灰色预测案例分析 例 由1990-2001年某地蔬菜产量,建立模型预测该地2002年蔬菜产量,并对预测结果做检。
1 2 3 4 5 6 7 8 9 10 11 12 13 14 15 16 17 18 19 20 21 22 23 24 25 26 27 28 29 30 31 32 33 34 35 36 37 (1 )编写函数文件function [x,c,error1,error2] =GM11 (x0,k) length (x0);1 )=x0(1 );for i =2 :ni )=x1(i -1 )+x0(i ); end for i =1 :n-1 i ,1 )=-0.5 *(x1(i )+x1(i +1 ));i ,2 )=1 ;i )=x0(i +1 );end -1 )*B'*Y'; 1 ,1 );2 ,1 );1 )-d;1 )=x0(1 );for i =1 :n-1 i +1 )=c*exp (-a*i )+d;i +1 )=x2(i +1 )-x2(i );end for i =(n+1 ):(n+k)i )=c*exp (-a*(i -1 ))+d;i )=x2(i )-x2(i -1 );end for i =1 :ni )=x(i )-x0(i );i )=abs (error(i )); i )=error1(i )/x0(i ); end
1 2 3 4 (2 )matlab操作代码19519 ,19578 ,19637 ,19695 ,16602 ,25723 ,30379 ,34473 ,38485 ,40514 ,42400 ,48337 ];1 ;
1 2 3 4 5 6 7 结果展示1 至 9 19519 39097 58734 78429 95031 120754 151133 185606 224091 10 至 12 264605 307005 355342
1 2 3 4 5 6 7 8 9 10 11 12 13 14 15 16 17 18 19 ------------------------------------x1的紧邻矩阵----------------------------------1.0e+05 *-0.2931 0.0000 -0.4892 0.0000 -0.6858 0.0000 -0.8673 0.0000 -1.0789 0.0000 -1.3594 0.0000 -1.6837 0.0000 -2.0485 0.0000 -2.4435 0.0000 -2.8580 0.0000 -3.3117 0.0000 1 至 9 19578 19637 19695 16602 25723 30379 34473 38485 40514 10 至 11 42400 48337
1 2 3 4 5 6 7 8 9 10 11 12 13 ----------------------------------最小二乘法的参数---------------------------0.1062 1.4000e+04 "language-matlab line-numbers" >-------------------------------------预测序列----------------------------------1.0e+04 *1 至 11 0 1.6958 1.8858 2.0971 2.3321 2.5934 2.8840 3.2072 3.5666 3.9662 4.4107 12 至 13 4.9049 5.4546
1 2 3 4 5 6 7 8 9 10 11 12 13 14 15 16 --------------------------------------残差值-------------------------------------1.0e+04 *1 至 11 1.9519 0.2620 0.0779 0.1276 0.6719 0.0211 0.1539 0.2401 0.2819 0.0852 0.1707 12 0.0712 1 至 11 1.0000 0.1338 0.0397 0.0648 0.4047 0.0082 0.0506 0.0696 0.0733 0.0210 0.0403 12 0.0147 0.4879
列数据 1 2 3 4 5 6 fprintf('%s\n' ,'-----------------1991-2001年GM(1,1)灰色系统预测值与实际值比较---------------' )' %s %s %s %s %s\n' ,'年份' ,'预测值' ,'实际值' ,'残差' ,'相对误差' );for i =2 :12 ' %d %20.4f %15.4f %15.4f %13.4f\n' ;i ),X1(i ),y(i ),e1(i ),e2(i ));end
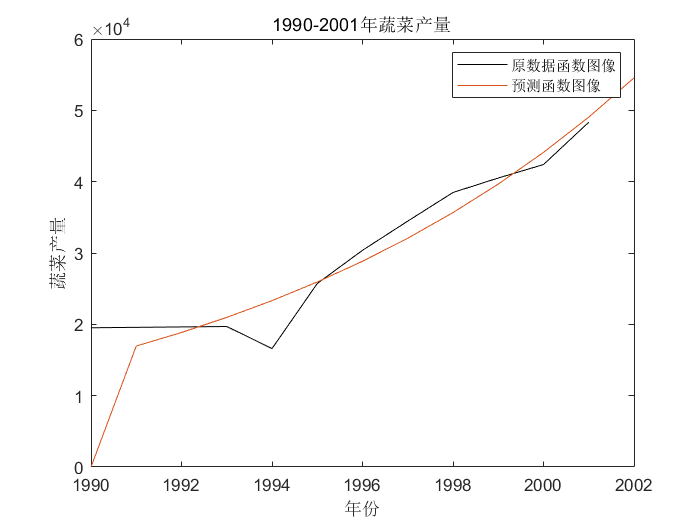
1 2 3 4 5 6 7 8 9 10 11 12 13 ----------------1991 -2001 年GM(1 ,1 )灰色系统预测值与实际值比较---------------1991 16957.6939 19578.0000 2620.3061 0.1338 1992 18857.9037 19637.0000 779.0963 0.0397 1993 20971.0433 19695.0000 1276.0433 0.0648 1994 23320.9727 16602.0000 6718.9727 0.4047 1995 25934.2255 25723.0000 211.2255 0.0082 1996 28840.3088 30379.0000 1538.6912 0.0506 1997 32072.0359 34473.0000 2400.9641 0.0696 1998 35665.8972 38485.0000 2819.1028 0.0733 1999 39662.4718 40514.0000 851.5282 0.0210 2000 44106.8863 42400.0000 1706.8863 0.0403 2001 49049.3236 48337.0000 712.3236 0.0147
绘制图像 1 2 3 4 5 6 7 8 t=[1990 1991 1992 1993 1994 1995 1996 1997 1998 1999 2000 2001 2002 ]plot (t(1 :12 ),y,'k' ,'Markersize' ,10 )hold onplot (t,X1)legend ('原数据函数图像' ,'预测函数图像' )'年份' )'蔬菜产量' )'1990-2001年蔬菜产量' )
参考

